How to measure black hole spin?
Measuring black hole spins is much more intriguing than measuring masses. In this chapter, we are going to explain the basics of few methods that is possible to use.
In principle there are several methods than can be used to measure spins of black holes. Each one uses quite a different strategy and is more suitable for a different type of objects. Some of the methods require instrumentation that is not currently available.
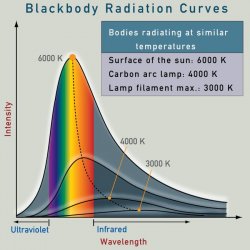 The first method that we describe uses a pretty simple idea. But before going into details, let's have a look at something slightly different. Did you know you can measure the radius of a star even if the star is light years away? We do not resolve stars in telescopes, they are too far for that and appear like a point source. The idea of measuring their surface uses a bit of physics. The visible light that comes from stars does come from a relatively thin surface layer that is called photosphere (on the Sun, this is the layer where we see sun spots). This layer produces radiation because the gas there is hot, just as well as an incandescent light bulb produces light because the filament wire inside it is heated to a high temperature by an electric current passing through it. The photosphere also has the same spectrum as the light bulb (if we scale out the temperature difference). The physics teaches us what it the total amount of radiation that is produced by a source of a given temperature per interval of time. It is the Stefan-Boltzmann law and it says that the radiation flux is proportional to the fourth power of temperature. For instance, according to this law you can calculate that a human body that has the temperature of 37°C should produce about one kilowatt of radiation power. Sounds like a big number? Well, in normal circumstances a human body also absorbs some energy from its surrounding environment, so that in a room with temperature of 20°C the net radiation power emitted by a naked body is only about 150 watts.
 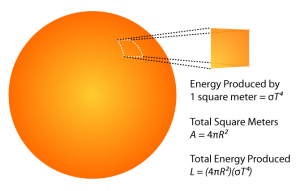 Now, coming back to measuring star radius, if we know the surface temperature of the star, we can calculate the total radiation power it releases using the Stefan-Boltzmann formula. However, we do not observe all the radiation if the star. The radiation goes to all directions and only a small part hits the Earth. The fraction is the same as the ratio of the surface of the star to the surface of the sphere that has its radius equal the star-Earth distance. The rest is a simple calculation. We measure the total amount of light from the star that reaches the Earth, from the spectrum we measure its temperature, and from precise position variation measurements we measure its distance. Then, combining all the above described relations, we can recover the star's surface area and thus its radius easily.
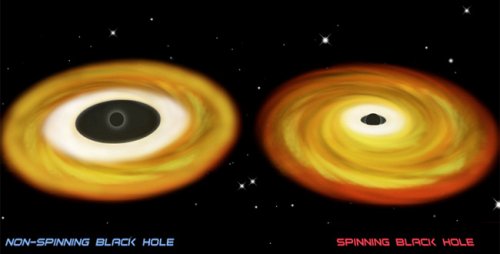
The very same method can be also used to measure accretion disks and the spin of black holes. Remember that the accretion disk does not extend all the way down to the black hole vent horizon, but relativistic effects force it to terminate at some particular radius and the diameter of the inner hole in the disk depends of the spin of the central black hole. If we imagine the accretion disk as a surface of a star, then by reading its temperature from the spectrum and by knowing the distance of the system, we can calculate the radius of the disk. Actually, what we calculate is the radius of the inner hole in the disk and from there we read directly the spin of the black hole. The higher spin of the black hole, the closer the disk can go and the higher temperature it reaches. The details are bit more complicated than how are we describing it, but the idea is that simple.
This is one of the things we do within the StrongGravity project. We compute precisely the structure of accretion disks and their radiation spectra, so that we have models which we can compare to real data taken by X-ray satellites. Comparing the data with the models we can choose the model which fits the data best and recover the parameters of the black hole.
Fluorescence of the iron line
The second method is based on a so called fluorescence effect in which a substance that is illuminated by a source of radiation emits its own light at some lower frequency and therefore lower energy that the absorbed light. A common example of this effect is a florescent tube that makes a frequent source of light in offices, schools, and also in its compact version at homes. In the tube, an electric discharge excites atoms of mercury vapor which produce short-wave ultraviolet light that then causes a phosphor coating on the inside of the bulb to fluoresce, producing visible light.
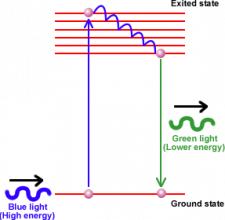 The same effect works in accretion disk, although at much higher energies. Hard X-ray photons coming from an energetic coronal region that surrounds the central black hole hit the surface layers of the accretion disk, where they excite electrons in atoms of iron. The stuff in the accretion disk is mainly made of hydrogen atoms with some amount of helium and a small amount of other light elements. Matter is supplied to the disk by the companion star and thus has the same chemical composition. The companion star usually is already evolved enough to contain other products of nuclear burning then hydrogen and helium. It contains amounts of lithium, oxygen, nitrogen, and also iron, which is the last element in the chain of nuclear reactions (burning of iron does not, apart from lighter elements, produce energy). So there is iron in the accretion disk too. When a hard X-ray photon hits an atom of iron, it can excite the lowest energy electron to a higher level. The electron will then continuously loose energy and move to gradually lower energy levels until it reaches back its original lowest energy state. During each jump between the two neighboring energy levels it releases a photon carrying out the energy difference. The jump from the last but one to the last energy level makes a difference 6.4 kiloelectronvolts (keV) in energy and correspondingly a photon of that energy is emitted.
The iron line fluorescence is special in few aspects. Iron is reasonably abundant in the disk and it is a substantially heavy element with large energy difference between the two lowest election energy levels (fluorescence in lighter elements is dumped by Auger effect). The energetic corona provides enough of hard X-ray photons to excite the florescence and in addition, 6.4 keV, which is the energy of emitted photons, is in the X-ray region of the electromagnetic spectrum that we use to observe accretion disks. All this makes the iron fluorescent line a very prominent feature in the accretion disk emission spectrum.
Although the fluorescent photons do all have precisely the same energy of 6.4 keV, when then reach our detectors their energy may be shifted. This is because the photons are emitted from different places in the accretion disk that have different projected velocity and the Doppler effect causes the photon energy to either blue-shift or red-shift. On top of that there is also an energy shift due to strong gravity - photons that come from regions close to the black hole arrive with lower frequency than hay had when they were emitted. This is the relativistic effect described in Chapter 2. As a result, when we integrate over all places on the disk surface and account for all the energy shifts, we get a very characteristic profile of the fluorescence photon energy spectrum. Instead if a single energy peak it has an extended shape spanning a range of few kiloelectronvolts.
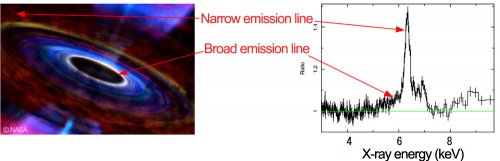
The exact shape of the line profile can tell us a lot. Its low energy extend tells us from how close to the black hole the photon can arrive, thus how close to the black hole does the accretion disk reach. The hard energy extend gives information about the highest projections of orbital velocities in the disk. From the first number we can directly recover spin of the black hole, from the second orientation of the disk (its inclination with respect to the our line of sight).
Other methods
There are other methods with the help of which we can determine the spin of a black hole. But currently they cannot be used directly.
A polarization of X-ray photons can be measured and used to constrain the black hole spin. But we do not yet have an X-ray satellite capable of polarimetric measurements. It can be built and deployed, but it is simply too expensive to put one up giving the amount of new information we would get. Therefor all efforts have so far been damped.
Timing could serve as a good tool to. The amount of emitted radiation that leaves an accretion disk at any moment is far from steady. There are huge temporal variations on all timescales. Long-term variability provides us with information about the global processes in the accretion disk, particularly about how does the accretion rate changes with time, i.e. how rich or sparse is the supply of fresh material to the disk from the donor star or from the outer environment. Variability on very short timescales, on the other hand, provide information about processes that take place where the matter rotates rapidly, which is close to the accretion disk inner edge which is also close to the central black hole. If we convert the light-curve into Fourier space (do a frequency analysis), we can see how much of radiation is produced at each frequency. Sometimes we see that a some specific tune is played quite strongly by the disk. Because the frequency of that tune is high, we know that it must be produced very close to the disk inner edge. If we understood why that particular frequency was picked up and what physical process was responsible for that, we could deduce some information about the inner parts of the accretion disk and about the black hole too. The problem here is that we have a number of ideas why such tunes can appear, but none of them is so far able to explain all the observed features and thus we do not which one applies (if any).